Snapshot of FDA CDER IND Activity 2024-25
October 29, 2025
As the U.S. innovation engine enters 2025, FDA CDER data tell a clear story: R&D growth is no longer about volume—it’s about focus. While IND filings continue to rise, the real action is shifting toward biologics, cell and gene therapies, and rare disease programs that demand deeper regulatory engagement.
This issue unpacks the FDA’s latest CDER IND activity data (2020–2024), explores where sponsor momentum is strongest, and outlines what these patterns mean for your submission strategy in the year ahead.
IND Activity at a Glance — The 2024 Snapshot
Innovation Holds Steady, Even as Growth Levels Off
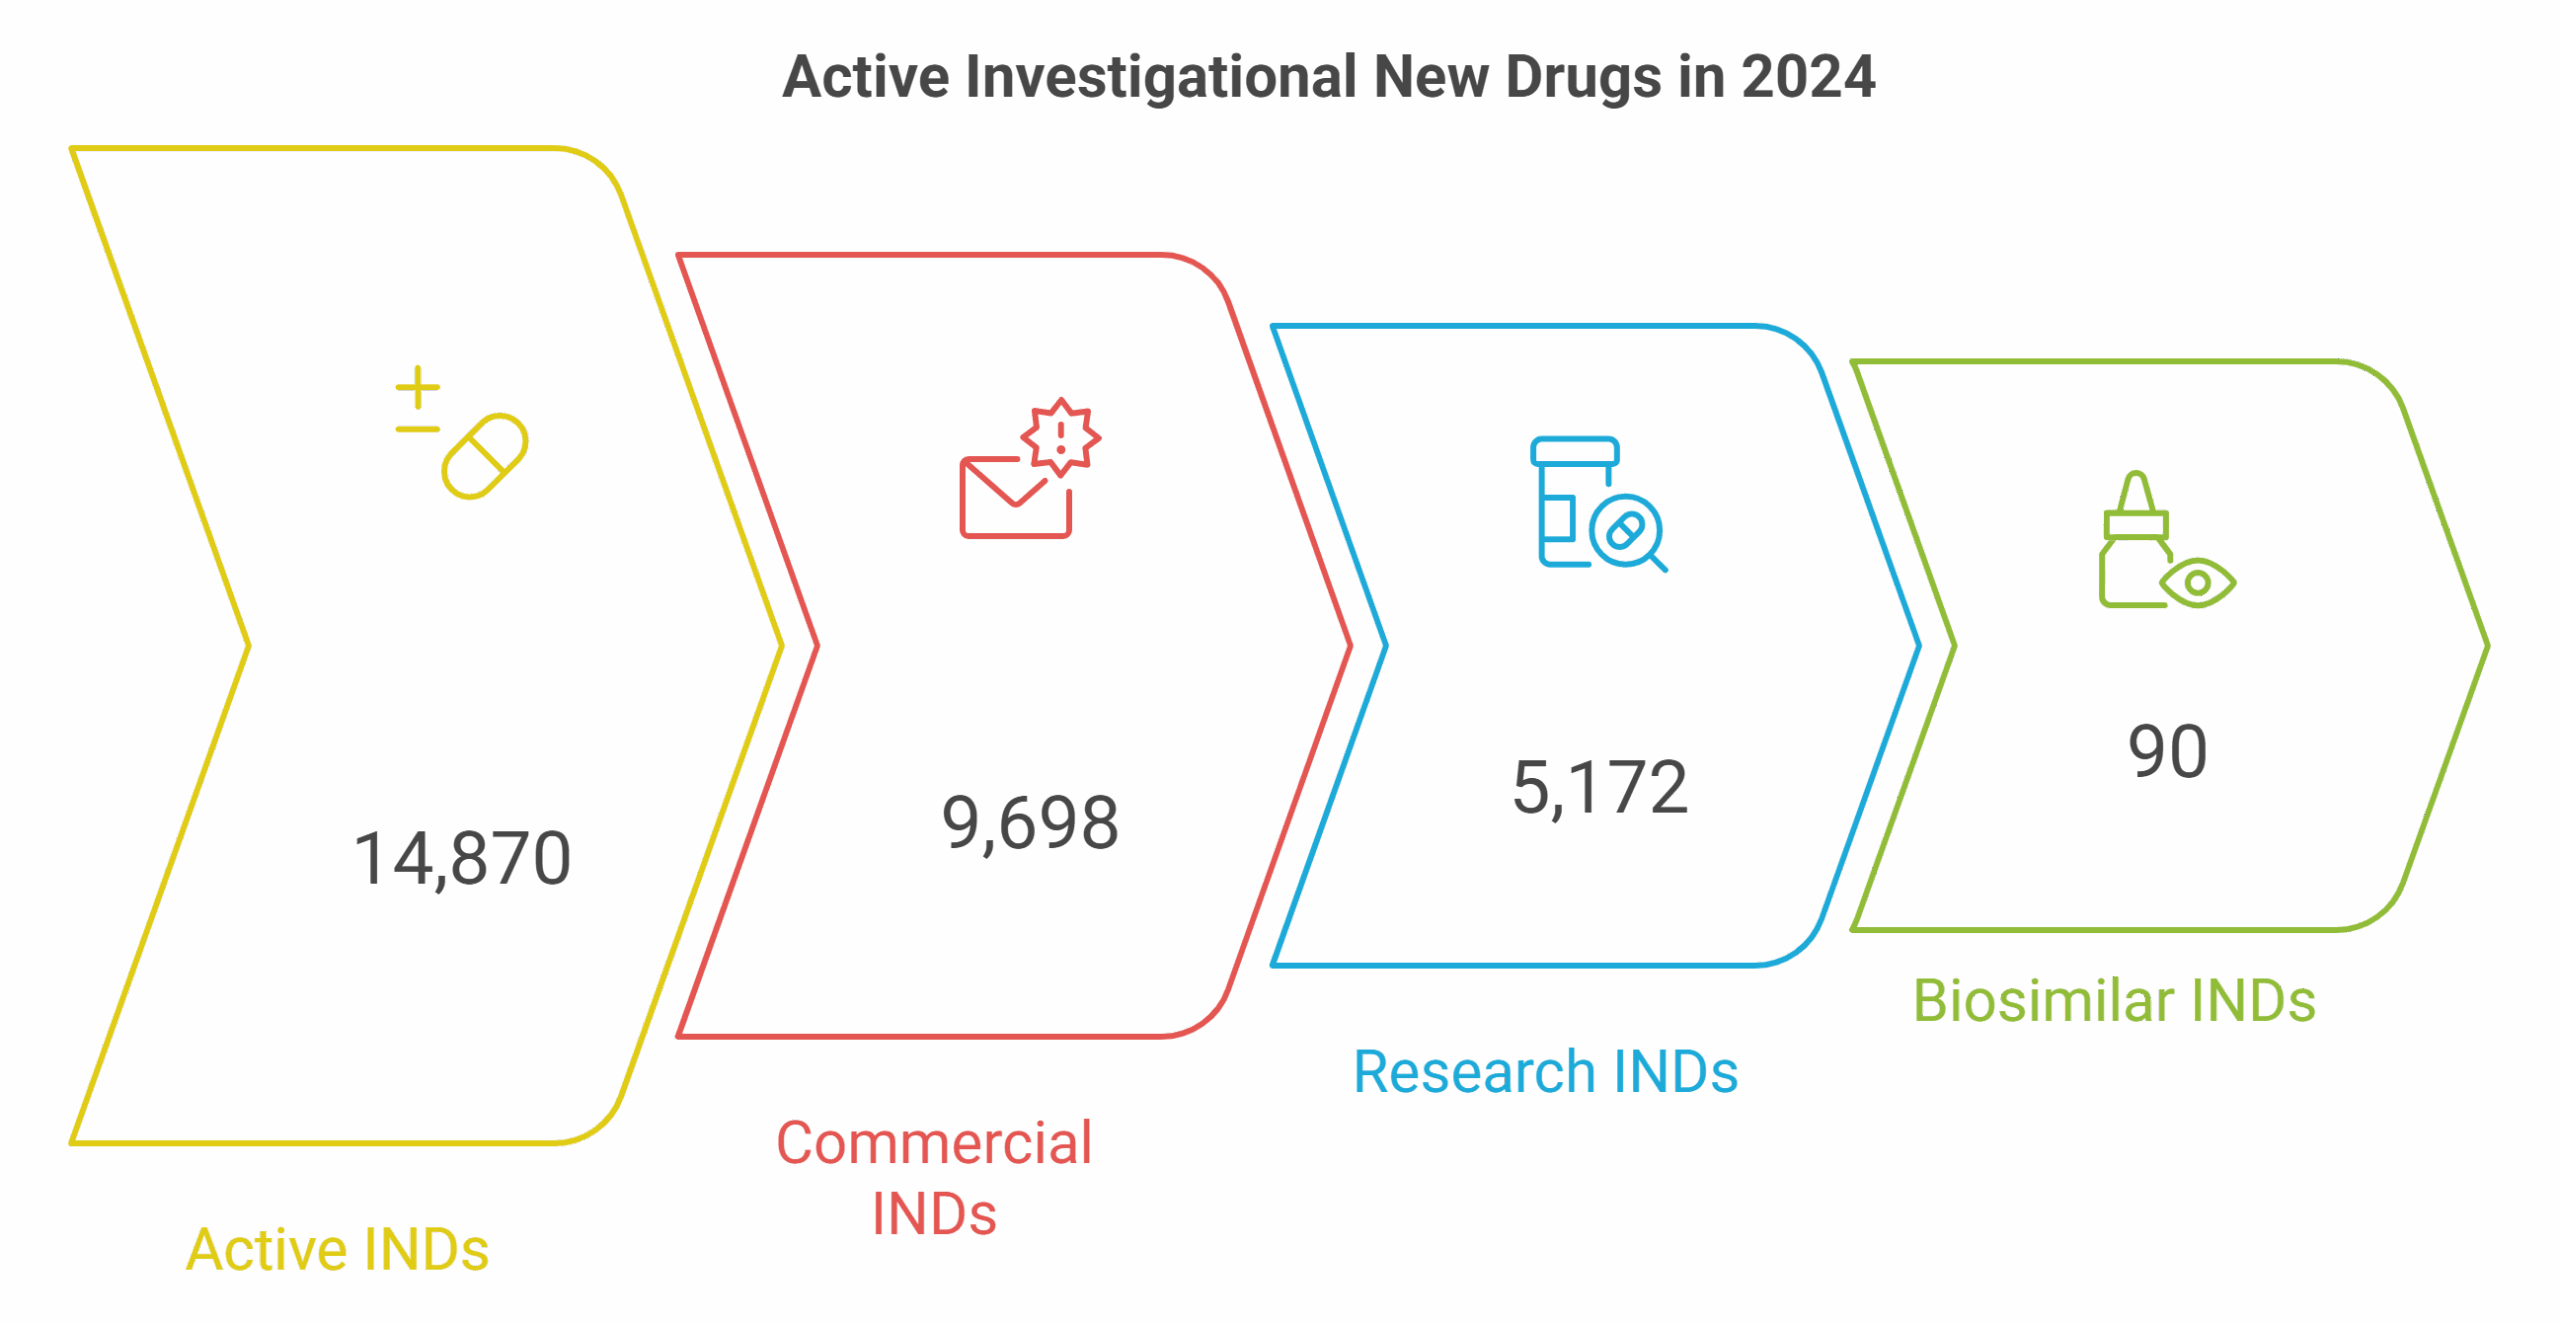
In 2024, the FDA’s Center for Drug Evaluation and Research (CDER) reported 14,870 active INDs for drugs and non-biosimilar biologics—up modestly from 14,622 in 2023 (+1.7% YoY). Of these, 9,698 were commercial and 5,172 research INDs, a mix that underscores the balance between early discovery and industry-led development.
By contrast, biosimilar INDs remain limited (90 active, 89 commercial)—a reminder that U.S. R&D remains centered on innovation rather than replication. The steady yet selective growth pattern suggests a maturing pipeline, with resources becoming increasingly concentrated in high-impact therapeutic areas.
New IND Filings: A Reliable Pulse on Early R&D
CDER logged 1,855 new IND receipts for drugs and non-biosimilar biologics in 2024, including 1,139 commercial and 716 research applications. Despite capital constraints across the biotech sector, this inflow reflects continued early-stage vitality.
Meanwhile, biosimilar submissions (15 in total, all commercial) indicate a stable yet targeted development ecosystem—steady interest from established players, but not yet an explosion of entrants.
Five-Year Trendline: From Expansion to Optimization
|
Year |
Drug & Non-Biosimilar Biologics INDs |
YoY Change (%) |
Biosimilar Biologics INDs |
YoY Change (%) |
|
2020 |
12,935 |
— |
77 |
— |
|
2021 |
13,810 |
+6.8% |
79 |
+2.6% |
|
2022 |
14,268 |
+3.3% |
82 |
+3.8% |
|
2023 |
14,622 |
+2.5% |
84 |
+2.4% |
|
2024 |
14,870 |
+1.7% |
90 |
+7.1% |
Between 2020 and 2024, active INDs climbed 15% overall—from 12,935 to 14,870—marking five consecutive years of expansion. Yet, growth has clearly shifted from acceleration to optimization, slowing from +6.8% in 2021 to +1.7% in 2024.
Biosimilars, on the other hand, saw renewed momentum, rising from 77 to 90 active INDs (+17% total), with 2024 posting their fastest YoY growth in four years (+7.1%). This emerging traction suggests that, as biologic patents continue to expire, biosimilars are quietly setting the stage for a more competitive marketplace.
Quick Insights
• R&D Engine Still Expanding—But Cooling: IND growth remains positive for the fifth straight year, signaling sustained innovation even as the pace moderates.
• Biosimilars Quietly Accelerate: The 7% YoY bump marks renewed sponsor confidence and diversification beyond reference biologics.
• Commercial vs. Research Split: In 2024, INDs were 65% commercial / 35% research for drugs and biologics—showing consistent industry investment.
• Fresh Pipeline Inflow: New filings (1,855 total) offer a leading indicator for 2025–26 trial starts and potential therapeutic hot spots.
Strategic & Regulatory Trends Driving IND Activity
The FDA’s 2024 data reveal a dynamic and maturing innovation landscape: biologics and advanced therapies are commanding greater attention, while small molecules slowly give ground. Below are five key shifts shaping how sponsors design, fund, and position U.S. development programs.
|
Emerging Trend |
Observation |
Strategic Implication |
|
Biologics Continue to Rise |
Non-biosimilar biologic INDs have posted steady growth for 4 consecutive years. |
Confirms that antibody, recombinant protein, and fusion technology pipelines remain a high-return investment zone. |
|
Cell & Gene Therapies Expand |
2024 filings show a higher proportion of cell and gene therapy INDs, reflecting cross-center coordination between CDER and CBER. |
Sponsors benefit from improved FDA guidance pathways but must plan early for CMC and comparability complexities. |
|
Rare Disease & Oncology Dominate |
Nearly 40% of active INDs now target rare or oncology indications. |
Expect increasing competition for trial sites and patient recruitment in orphan-designated areas. |
|
Small Molecules Decline Gradually |
IND submissions in the central nervous system and metabolic diseases continue to dip. |
Capital and regulatory attention are migrating toward higher-value biologic and targeted modalities. |
|
AI-Assisted Drug Design Emerges |
Several INDs reference AI-driven molecule design or target selection. |
The FDA has begun scrutinizing data provenance and algorithm validation, expect new review expectations in 2025. |
The Broader Picture
The FDA’s CDER IND data offer a leading indicator of where U.S. innovation is heading: the innovation frontier has moved upstream. Sponsors are leveraging advanced biologics and platform-based R&D to sustain value creation even as the overall IND growth rate cools.
At the same time, the FDA’s oversight structure is evolving. The clearer delineation between CDER and CBER responsibilities—particularly for cell and gene therapies (CGTs)—is improving predictability for early regulatory interactions, especially at the pre-IND stage.
In short, the IND phase is becoming not just an administrative milestone, but a strategic inflection point for clinical and regulatory success.
Implications & Next Steps for Sponsors
FDA’s IND statistics aren’t just a reflection of activity — they’re a predictive signal of where regulatory energy and investor confidence are headed. The following steps can help sponsors turn that intelligence into a competitive edge.
- Benchmarking Pipelines: Compare internal IND portfolios against FDA trends to identify under- or over-invested therapeutic categories and rebalance R&D strategy.
- Engaging Early: Prioritize pre-IND and INTERACT meetings to clarify expectations for CGTs, AI-enabled programs, and complex biologics.
- Preparing for Biosimilar Competition: Anticipate 2025–26 interchangeability and labeling developments to shape lifecycle and defense strategies.
Closing Thought
The FDA’s 2024 IND landscape reflects a sector in evolution: steady growth, rising complexity, and a decisive pivot toward biologics and advanced modalities. For sponsors, success now depends less on volume and more on precision — aligning the right science with the right regulatory strategy at the right time.
Growth may be stabilizing, but innovation is deepening.
References
- FDA CDER. INDs with Activity, 2024
- FDA CDER. IND Receipts, 2024
- CDER Achievements 2024 (FDA Voices, 2025)
Analysis and interpretation by BLA Regulatory, LLC, based on FDA-published data.


